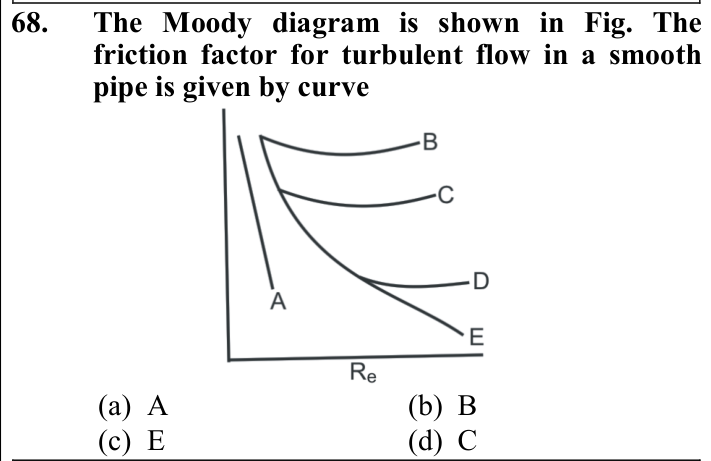
[Image Question - Moody Diagram] The Moody diagram is shown in Fig. The friction factor for turbulent flow in a smooth pipe is given by curve
- A. A
- B. B
- C. E
- D. C
Answer: C. E
Explanation: For smooth pipes, friction factor depends only on Reynolds number and follows the lowest curve in the turbulent region.