Topic: Thermodynamics
The volume versus temperature T graph for a certain amount of a perfect gas at two pressure $P_{1}$ and $P_{2}$ are as shown in the figure. It can be concluded that-
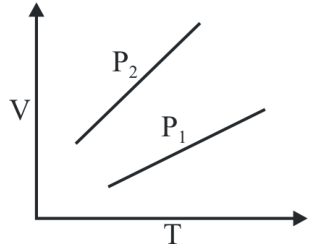
- A. The pressure $P_{1}$ is greater than the pressure $P_{2}$
- B. The adiabatic index for $P_{1}$ is higher than that for $P_{2}$
- C. $P_{1}$ represents monoatomic gas and $P_{2}$ represents diatomic gas
- D. None of the above
Answer: A. The pressure $P_{1}$ is greater than the pressure $P_{2}$
Explanation: From the Ideal gas equation, $PV=mRT \Rightarrow V = (\frac{mR}{P})T$. Thus, the slope of the V-T graph is $\frac{V}{T}=\frac{mR}{P}$. From the graph, $(Slope)_{2} > (Slope)_{1}$, which implies $\frac{R}{P_{2}} > \frac{R}{P_{1}}$. Therefore, $P_{1} > P_{2}$.