Section: General Aptitude | Marks: 2
The monthly rainfall chart based on 50 years of rainfall in Agra is shown in the following figure. Which of the following are true? (k percentile is the value such that k percent of the data fall below that value) (i) On average, it rains more in July than in December (ii) Every year, the amount of rainfall in August is more than that in January (iii) July rainfall can be estimated with better confidence than February rainfall (iv) In August, there is at least 500 mm of rainfall
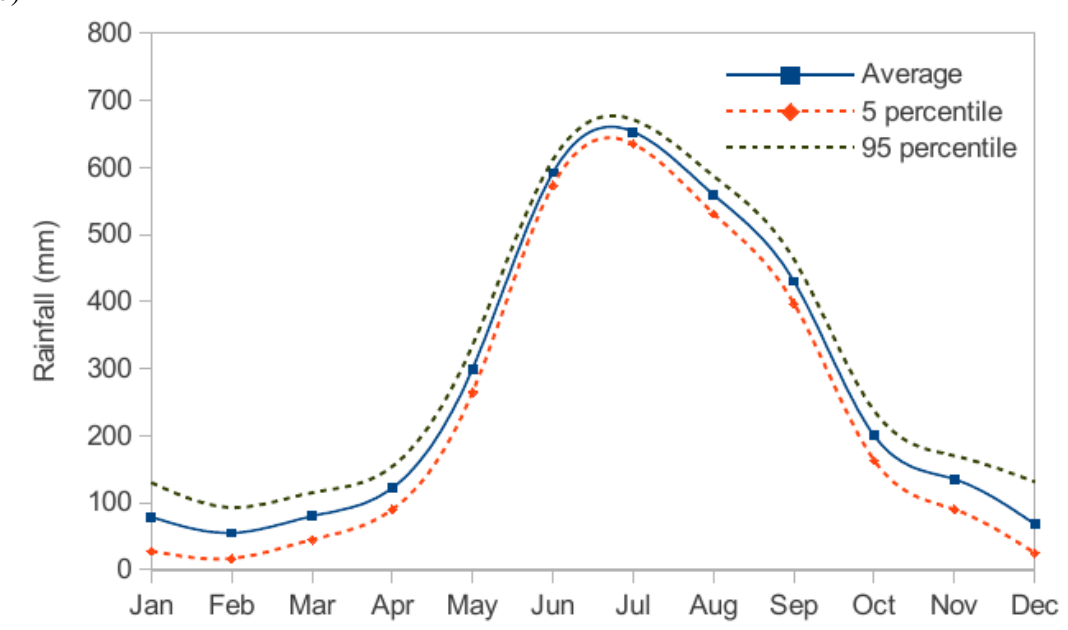
- A. (i) and (ii)
- B. (i) and (iii)
- C. (ii) and (iii)
- D. (iii) and (iv)
Answer: B. (i) and (iii)