Topic: Operating Systems
Analyze the below resource allocation graph, Which of the following is the corresponding wait-for graph?
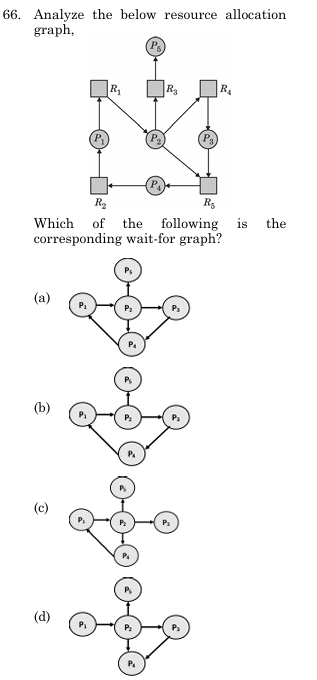
- A. Wait-for graph option A
- B. Wait-for graph option B
- C. Wait-for graph option C
- D. Wait-for graph option D
Answer: C. Wait-for graph option C
Explanation: A wait-for graph removes the resource nodes and adds a directed edge $P_i \rightarrow P_j$ if process $P_i$ is waiting for a resource held by $P_j$. From the resource allocation graph: P1 requests R1 (held by P2) $\Rightarrow P_1 \rightarrow P_2$. P2 requests R3 (held by P5) $\Rightarrow P_2 \rightarrow P_5$. P2 requests R4 (held by P3) $\Rightarrow P_2 \rightarrow P_3$. P2 requests R5 (held by P4) $\Rightarrow P_2 \rightarrow P_4$. P3 requests R5 (held by P4) $\Rightarrow P_3 \rightarrow P_4$. P4 requests R2 (held by P1) $\Rightarrow P_4 \rightarrow P_1$. Option (c) correctly displays exactly these edges.