Section: General Aptitude | Marks: 2
Which of the following functions describe the graph shown in the below figure?
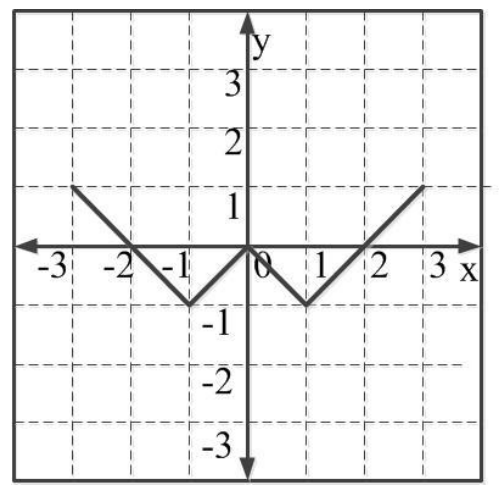
- A. 𝑦= ||𝑥| + 1| −2
- B. 𝑦= ||𝑥| −1| −1
- C. 𝑦= ||𝑥| + 1| −1
- D. 𝑦= ||𝑥−1| −1|
Answer: B. 𝑦= ||𝑥| −1| −1
All GATE XE (Engineering Sciences) papers | GATE XE (Engineering Sciences) 2018
Section: General Aptitude | Marks: 2
Which of the following functions describe the graph shown in the below figure?
Answer: B. 𝑦= ||𝑥| −1| −1
Previous question | Next question | All questions of GATE XE (Engineering Sciences) 2018