Section: Thermodynamics | Marks: 1
Which of the following processes, shown in the figure below, represents the throttling of an ideal gas?
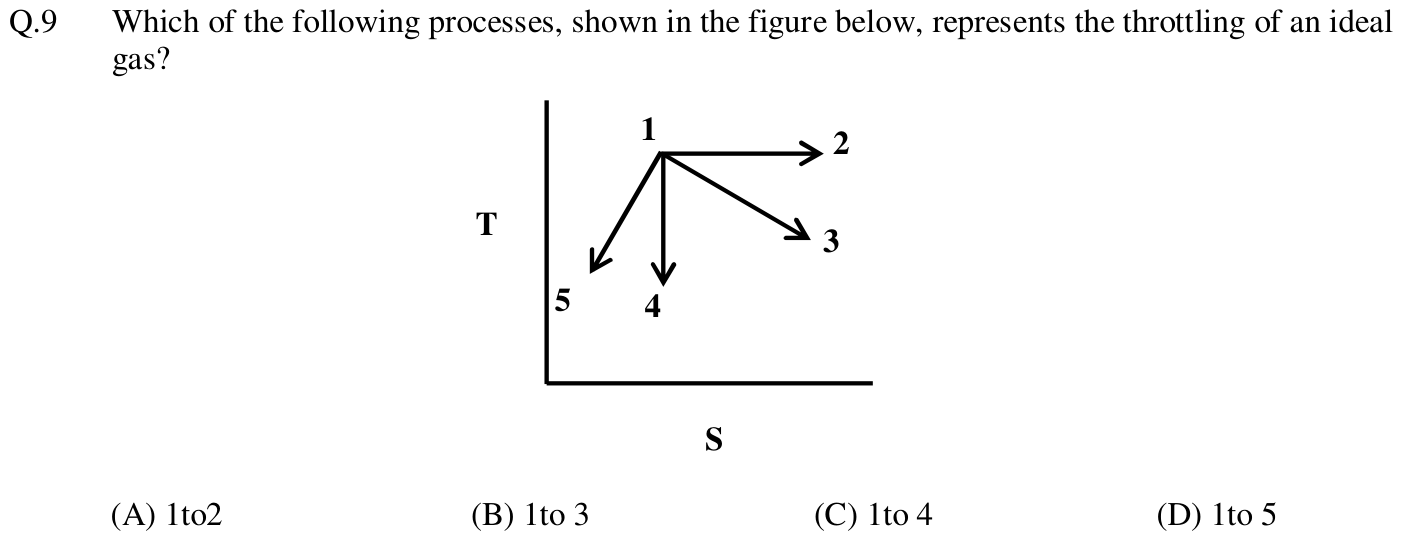
- A. 1to2
- B. 1to 3
- C. 1to 4
- D. 1to 5
All GATE XE (Engineering Sciences) papers | GATE XE (Engineering Sciences) 2013
Section: Thermodynamics | Marks: 1
Which of the following processes, shown in the figure below, represents the throttling of an ideal gas?
Previous question | Next question | All questions of GATE XE (Engineering Sciences) 2013